More actions
Main article: Voting Methods
What it is
A cardinal voting system is one where voters give an independent rating to each preference, in contrast to merely ranking their preferences. This requires more information but avoids Arrow’s paradox and provides higher quality results, especially for policy-level decision making. It is frequently the case that voters care a great deal about a few subjects and are mostly indifferent to the rest. An ordinal voting system forces a ranking of all choices, even ones the public is mostly indifferent to. A cardinal voting system captures the important issues with less effort and allows policy to focus on those.
It should be noted that Arrow himself dismissed cardinal voting systems because the strength of anyone’s preference is not objectively comparable with that of anyone else:
“It seems to make no sense to add the utility of one individual, a psychic magnitude in his mind, with the utility of another individual.”
He believed, therefore, that only ordinal systems made any sense.
Nevertheless, let’s take a look at how we might achieve a cardinal voting system using one of our applications, eg Foreign Policy. The goal is to develop a top-level foreign policy. We could start by asking our network the question, “what should our foreign policy be?”. It is very open ended but let’s start here and then explore variants on how we might ask such a question differently. Some members of the network will come forward with answers. We can deal with these answers in various ways:
- Just pick the best one, say, by a judge or panel of judges.
- Blend them in some way that seems best, again according to some judging committee.
These two are not likely to win approval of a majority if the majority has no input. So ways to gain input might include:
- Ask the network to rate each policy on various characteristics which are then weighted using an equation. The highest rated policy wins.
- Try to improve on the highest rated policy by blending it with some of the other policies or new ideas. Go through the network rating again and try to “optimize”.
After network-based ratings come in, we would normally apply our rating of the network participants. But, since this a public decision we could impose the rule that everyone is treated equally, unless we have a previous vote that allows a difference in weight for those who, for instance, are very knowledgeable about the subject.
Let’s do an example with some simple math to show how this might work. Let’s suppose we get three answers:
- US foreign policy should be to promote democracy around the world by giving aid to emerging democratic countries and democracy movements in undemocratic countries.
- US foreign policy should be to promote human rights around the world.
- US foreign policy should be to use its intelligence and military capabilities to actively overthrow dictatorships around the world.
The criterion by which each policy is rated is by its beneficial effect on the following:
- US economy, e
- US hegemony/power, h
- People outside the country we are affecting, p
- Adherence to moral principles, m
Each criterion can be 0-100, so a perfect score is 400.
Suppose the following ratings were obtained for each policy:
- Promote democracy ==> e = 20, h = 40, p = 30, m = 60 ==> total = 150
- Promote human rights ==> e = 10, h = 20, p = 70, m = 80 ==> total = 180
- Overthrow dictatorships ==> e = 30, h = 60, p = 40, m = 70 ==> total = 200
Our policy winner is 3, overthrowing dictatorships. Notice that although everyone participated in “voting” for this outcome, this choice may not represent the majority view. That is, if the three options had been put up for a straight vote, it is not necessarily the case that 3 would win. Furthermore, the more choices exist, the less likely it is that any one option would receive greater than 50% of the vote. So 3 could only win by plurality, not by majority. In situations like these, a runoff election could occur where we take the highest plurality winners and have a 2nd election and continue this process until clear majorities emerge.
For this reason it is important that the community choose its voting mechanism. Let’s suppose the voting mechanism is the weighted system described here followed by an “optimization round”, which is analogous to a post-plurality vote that seeks an outright majority. Here, we could take the two highest ranking options, 2 and 3, and combine them in some way, eg:
“US foreign policy should be to use its intelligence and military capabilities to actively overthrow dictatorships around the world while also promoting human rights. This means that we must ensure a new government (after the overthrow) is a respecter of human rights, we prioritize the dictatorship to be overthrown by how badly it violates human rights, and where overthrow is not possible we work to promote human rights in the country by direct help and undermining the violating government.”
It is easy to see how this policy, which combines the two priorities of the voting community, might be favored more than each one individually. A new vote would confirm that. A couple of differently worded “combination” policies could be formulated and put up for a vote, with the highest one being the winner and the one adopted as the “official” policy.
It is likely that a large, open ended question would result in few entries. Smaller, more focused questions might attract more contributors, eg “What should US policy toward Russia be in light of the Ukraine invasion?”. The sum of a series of such questions (and their answers) would then become the policy. The community, of course, would have to decide on such matters as how granular to make their participation. Perhaps they only want to participate at a high level or perhaps they want input into even the smallest decisions.
Issues with cardinal systems
Our discussion of ordinal vs cardinal voting systems generally concludes that cardinal systems are better. This is basically because they take into account the strength of preference and do not run into Arrow’s impossibility theorem. However, it should be noted that they are not a panacea.
Let’s suppose voters are asked what the most important things are to focus on:
- Outlaw abortion
- Tough on crime
- Improve economy
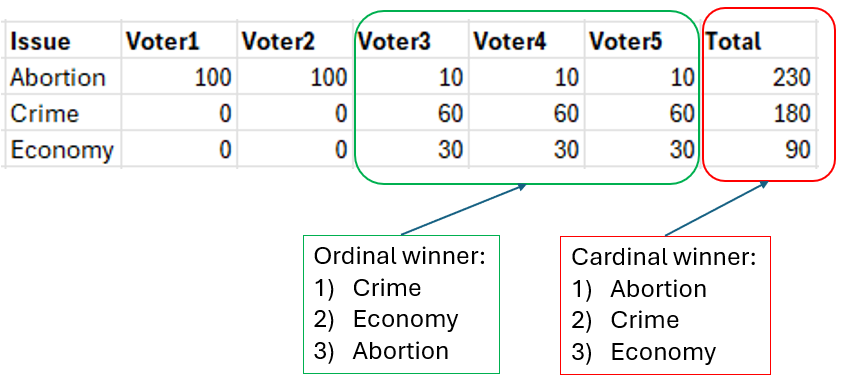
Each voter has 100 points to allocate. Two voters feel so strongly about abortion that they award all their points to that single issue. The other voters are united in viewing crime as the most important issue with abortion in last place. They happen to agree on their strength of preference but this is not a requirement to illustrate the point:
Here the cardinal voting system wins over a clear majority that prefers something else. This is because of the presence of two extremist voters but it can happen in more moderate cases as well. Our system, if it is to prefer cardinal voting systems (and I think it should, in general) needs to guard against these types of outcomes.
One idea would be to identify extremism and somehow derate it. If a voter puts all their points in one basket we can count their vote for less. Another way to do this would be to spread out their vote and give an equal number of points to the other priorities. Note that doing this is to begin turning the cardinal system into more of an ordinal one. We shouldn’t go all the way, of course, because ordinal systems have their own problems (as we’ve discussed) but we can come up with a set of adjustable rules that can be chosen by users.
Clearly this gives rise to an optimization exercise where some social metric of goodness is the objective function. Cardinal systems are already required to have weights for each criterion which can then be rolled up into an overall figure of merit and displayed on the y-axis of a Pareto chart. Obviously an approach like this appeals to engineers, especially systems engineers, but there is no reason why it can’t be used for social policy, which is nothing more than a system of people. We should note that JPL’s Team X, an advanced conceptual design center for spacecraft, uses both systems engineering tools and a surprisingly manual social approach to finalizing system designs. They literally have a designated specialist go around the room and synthesize every engineer’s viewpoint until a consensus emerges.
Donations to political causes and candidates was a form of cardinal voting, and a negative one at that. This is an example of a few actors with vastly greater resources than most tilting the playing field. In the US, at least, this practice has reached a level where it is tantamount to corruption.
Formal cardinal voting systems do not permit some people to have vastly more “points” than others. Everyone is presumably allocated the same number by default with adjustments made, perhaps, on the basis of reputation. This would no doubt be true for every vote but we could extend this idea to be true for multiple votes. We could, for instance, allocate a certain number of points to each user for all the votes currently being held and thereby force them to use those points judiciously. This would give policy makers a quick idea of what is really at issue and what can safely be ignored. It is common that elections revolve around a few key concerns even though the policy making arena is huge at any given time.
Modifying cardinal systems
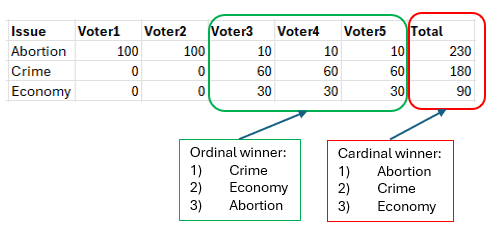
Above we mentioned that in cardinal voting systems people can skew the results by putting all their voting points on a single issue. We showed the case of an ordinal system with a clear majority preference vs a cardinal system which won on points because of single issue voters:
Needless to say, this result is not desirable. The winner should be the preference of Voter 3,4, and 5 which is the result that an ordinal system would produce (this result is not affected by Arrow’s theorem because a clear majority favors it). One way to handle this is to distribute the votes of the single issue voters in some way. Here we propose two ways to do this.
A cardinal to ordinal model
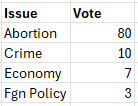
We can view an ordinal voting system as a special case of a cardinal system with equally spaced preferences. For example, let’s suppose we have 4 choices in a cardinal system:
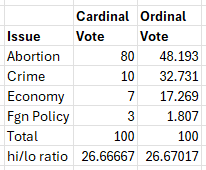
The only reason for 4 choices instead of the 3 we used previously is that it is easier to generalize 4 to any number of choices. So, we’d like to take this distribution and create one where the spacing between the rankings is the same. We will call this an “ordinal” result whereas the original vote was a cardinal result:
Note that the ratio of high to low values of the resulting “ordinal” vote matches that of the original cardinal vote. This is an arbitrary, although reasonable, constraint used to close the system of equations which will be discussed below.
We further note that this cardinal vote is not exactly the single issue vote we saw above. There is a distribution of preference for all the choices but the last three choices tend to cluster near the bottom while the first choice is weighted very highly. Let’s do this case first and then discuss how we can handle the situation where a voter assigns all their points to their first choice and zero to the remaining choices.
The ordinal result is achieved with the following set of equations:
Where
Preference for Abortion issue
Preference for Crime issue
Preference for Economy issue
Preference for Foreign policy issue
Number of preference points available per voter to be distributed among the issues
Ordinality factor, 0 = original cardinal vote, 1 = fully ordinal, ie equally spaced
Distribution factor – to change hi/lo distribution.
This system of equations, when solved, yields the result under the Ordinal vote in the table above:
The model has two user adjustable factors, and . is an “ordinality” factor which governs the evenness of the spacing between the choices. means spacing the same as the original and means spacing that is even. We presume that even spacing would equate to an ordinal system but this is just supposition. An ordinal system is just a rank ordering and doesn’t really have spacing between the choices. But we implicitly treat ordinal systems as if they had even spacing. One would think that the closest a cardinal system could get to an ordinal system, and still be a cardinal system, is when the choices are evenly spaced.
According to the model then, is evenly spaced, a fact which can be confirmed by noting that the difference between successive preferences is the same, ie:
If, say, then the spacing will be somewhere between that of the cardinal system and the fully “ordinal” one. We can create a table which gives us results for a few values to see how this works more clearly:
The transition to even spacing with is clearly not linear but the factor gives the user the ability to choose how to model single issue extremism and other skewed preference votes.
Another user-adjustable factor, governs the ratio between the highest and lowest scoring choice. Here we have set the ratio given the original cardinal vote,
and simply maintained it throughout. Choosing this ratio is required to make the equations close and a different constraint could certainly have been chosen. Note that choosing here would result in all the results being the same. Choosing results in a reversal of the preference ordering.
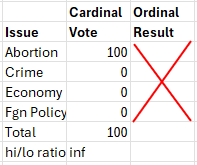
We noted above that this example was not exactly the single issue vote we saw last week. Indeed if we had tried a single issue case here, it would not have found a solution. For example, the following case would not work:
The problem is that the denominator in the above equations and is zero which causes the system to fail. This system cannot even deal with a tie vote for the same reason. Nevertheless this problem is easy to fix by simply adjusting the votes to be close but not equal to a single issue vote, eg
We note here that the answer will converge the closer we approximate our cardinal vote to the original single issue vote. We further note that the tie votes have been given some small differences to prevent the divide by zero error discussed above and are, hence, artificially ranked. This, of course, leads to an artificial ranking in the final result which could be kept but might be best handled by simply making them all the same:
Doing this treats them all equally in any final aggregation across multiple voters.
This system of equations can be solved with any simultaneous equation solver. We used our own SolverCAD for this case. An input file for the above set is attached here: card_to_ord_4.scin. The system as shown here only works for four preferences. It is straightforward, however, to generalize it to any number of choices. A dedicated program could be written to take in the input preferences, generate the requisite equations, and call SolverCAD to solve them. Alternatively, an algebraic solution is probably obtainable that could be generalized for any number of equations and written directly into such a dedicated program.
A simpler model
A simpler model can be obtained with the following set of equations:
where
Abortion preference
Crime preference
Economy preference
Foreign policy preference
Total preference points available to be distributed among all the choices
user factor where 1.0 represents no change and 0.0 represents all values equal.
This model is quite a bit simpler but doesn’t have a mechanism to enforce equal spacing (unless we count ) or the ratio of largest to smallest preference. It does not, in short, create an “ordinal” system as described above. But it is a way of redistributing extreme votes in a way that preserves, in some sense, the skewness of the original distribution. It also has the advantage of handling tie votes out of the box. We can generate the following table of results for different values of :
As decreases from 1.0 to 0.0 the original distribution converges until all the values are exactly the same. Any value above 0.0 produces a distribution that maintains, to one extent or another, the fact that the top-ranked choice (Abortion) is quite a bit higher than the other choices.
This system was also solved in SolverCAD with the input file attached herecard_to_ord_5.scin
